The price of the Shiba Inu has dropped 2% in the last 24 hours, and it now trades in the red at 0.00005140. The daily trading volume of SHIB has been decreasing in lockstep with the price, and it now stands at $2,379,346,807, down 52.14 percent in the last 24 hours

The price of the Shiba Inu has dropped 2% in the last 24 hours, and it now trades in the red at 0.00005140. The daily trading volume of SHIB has been decreasing in lockstep with the price, and it now stands at $2,379,346,807, down 52.14 percent in the last 24 hours. Over the same time period, Shiba Inu’s market capitalization fell by 2% to $28,140,426,224, dropping SHIB to 11th place in terms of market value.
All of them are negative indicators, indicating that the self-proclaimed “Doge Killer’s” current price decline may last for some time.
What Is The Lowest Price For Shiba Inu?
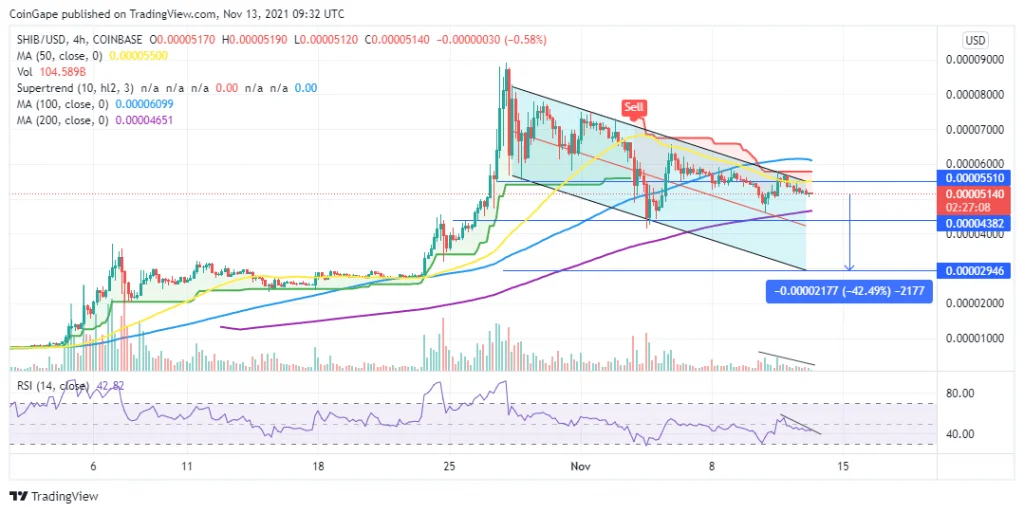
SHIBA has lost 42% from its all-time high (ATH) of $0.00008932 on October 28 to its current price of $0.00005140. On the four-hour chart, this price action has established a descending parallel, with the Shiba Inu price being consistently rejected by the channel’s upper border.
The 0.00005510 level, where the 50-period Simple Moving Average (SMA) intersects with the upper border of the channel, is providing immediate resistance to SHIB. The bullish breakout of Shiba Inu will require this level to be turned into support.
When SHIB overcomes the 10 SMA’s resistance at $0.00006099, a clear bullish breakthrough will occur. Following that, the ATH at $0.00008932 will be the next logical step.
Four-Hour SHIB/USD Chart

If the price does not break through the $0.000055 level, the current trend will continue. As a result, if the meme coin closes below the psychological barrier of $0.000050, it may drop to the middle border of the prevailing chart pattern around $0.00004225. If this support level fails to hold, SHIB might fall even deeper, with the current chart pattern’s goal at $0.00002926, a 43 percent decline from its current price.
The declining trade volume and down-sloping moving averages support this negative picture. Furthermore, the Relative Strength (RSI) indicator’s downward march towards the oversold zone indicates that the bears are currently in control of SHIB price, confirming the negative story.
Furthermore, on November 3, the SuperTrend indicator switched from bullish to bearish and moved above the price, signaling a sell signal. The bearish momentum is expected to persist as long as the SupetTrend indicator remains above the Shiba Inu price.
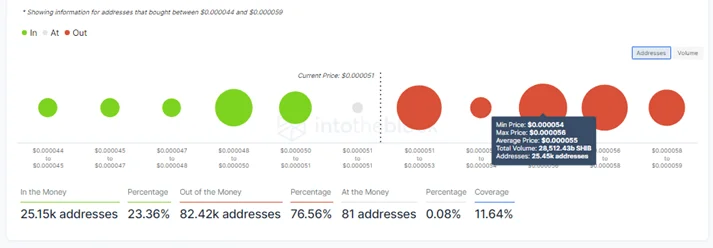
Furthermore, data from IntoTheBlock’s In/Out of the Money Around Price (IOMAP) model indicates that the Shiba Inu price is facing significant upward resistance, supporting the bearish thesis.
IOMAP Chart for the SHIBA Inu

The immediate resistance at $0.000055, for example, is between $0.000054 and $0.000056, where around 25,450 addresses previously purchased nearly 28,512 billion SHIB. Breaking even on any attempts to push the SHIBA price past this point may be a good idea for these investors.
