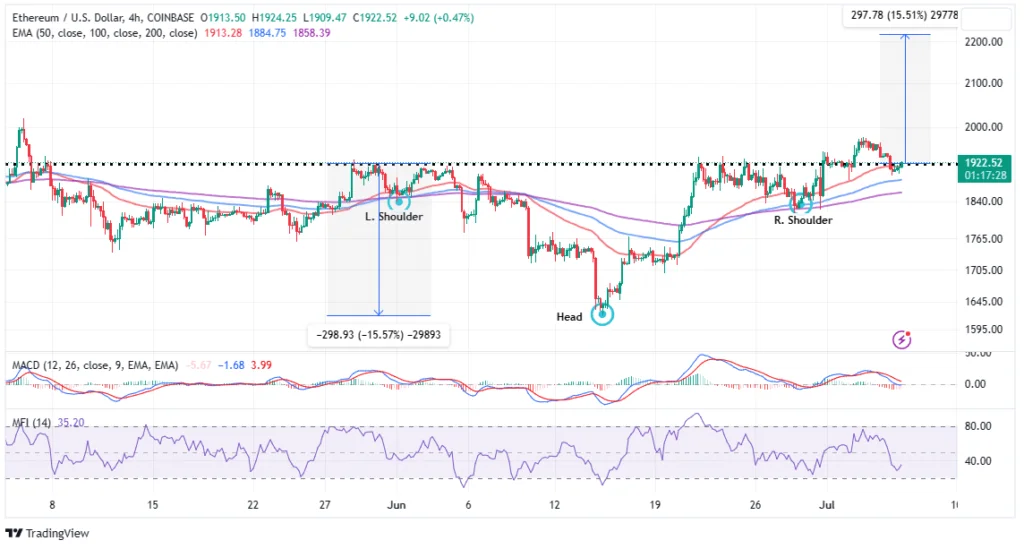
Ethereum price is reaffirming its favorable outlook with a potential 15.5% breakout to $2,220 from the head-and-shoulders pattern.

Ethereum price is reaffirming a crucial bullish posture that could lead to a rally above $2,000, with a short-term target of $2,220. But first, the most prominent token for intelligent contracts must reduce the buyer congestion near $1,950. This action would indicate that Ethereum is finally prepared to prolong its leg above $2,000 and close the gap to $3,000.
Can The Price of Ethereum Reach $2,000 This Week?
The price of Ethereum is on the verge of validating a significant breach, with the potential to propel it above $2,000 by the weekend. Completing an inverse head and shoulders (H&S) pattern at the end of June may initiate a 15.5% move to $2,200.
Inverse H&S is frequently regarded as a potent bullish indicator. It has three distinct troughs, with the deepest one constituting the ‘head’ and the two upper ones comprising the shoulders.’ The pattern indicates a potential reversal in a downtrend, as seen on the four-hour chart for Ethereum.
Traders who correctly identify this pattern will strategically place buy orders above the pattern’s “neckline,” presently $1,920 for ETH. This breakout typically signifies the end of pessimistic sentiments and the start of a new bullish era.
It is prudent to position the stop loss just below the neckline when the breakout occurs or to presume that the profit target will equal the pattern’s height from the neckline to the head, extrapolated from the breakout point. This bullish pattern can lead to a parabolic rise in Ethereum prices.

The 50-day Exponential Moving Average (EMA) (red line) provides near-term support for the Ethereum price, which is currently marginally above it. Traders anticipating initiating new long positions should wait until ETH establishes support above the inverse H&S neckline resistance to gain confidence in the forthcoming price rally.
According to the Money Flow Index (MFI), investors are beginning to favor a bullish outcome following the retracement from $1,980 to $1,895 since Monday. As the MFI index recovers toward the overbought region, Ether’s momentum will increase, facilitating a much-needed breakout above the psychological $2000 level.
The Moving Average Convergence Divergence (MACD) indicator may flash another buy signal during the sessions on Thursday and Friday. This call to investors to buy ETH would come into the picture, with the MACD line in blue crossing above the signal line in red.
In addition, the position of the momentum indicator above the mean line suggests that the Ethereum price has completed its correction, and bulls are preparing to take control.
Traders may look for sharp pullbacks by monitoring Ethereum’s reaction to the neckline resistance at $1,920 and the next obstacle at $1,950. A sustained position above either of these levels would indicate that bulls are still in play, allowing traders to maintain long positions.
If the 50-day exponential moving average (EMA) succumbs to selling pressure, the MACD will slide into the negative territory, extending the adverse trend into the weekend. Ethereum may seek respite from the stress of sale beginning at $1,884 (the 100-day exponential moving average) and $1,858 (the 200-day exponential moving average).

