Coinscreed
  • News
    • Bitcoin News
    • Ethereum News
    • Ripple News
    • Litecoin News
    • Altcoin News
    • DeFi
    • Blockchain News
  • Market Analysis
  • NFT
  • Metaverse
  • Cryptocurrencies
  • Learn
    • Bitcoin 101
    • Ethereum 101
    • Binance Smart Chain
    • DeFi 101
    • Ripple 101
    • ICO 101
    • Trading 101
    • Dogecoin 101
    • Lightening Network
    • NFT 101
  • Crypto How Tos
Advertise
No Result
View All Result
  • bitcoinBitcoin(BTC)
    $19,274.540.990% 24H
    BITCOIN
    24H : 0.990%
    Volume : $27,737,847,657.00
    Marketcap : $370,369,705,520.00
  • ethereumEthereum(ETH)
    $1,055.763.36% 24H
    ETHEREUM
    24H : 3.36%
    Volume : $18,015,277,425.00
    Marketcap : $126,401,729,495.00
  • binancecoinBNB(BNB)
    $220.386.03% 24H
    BNB
    24H : 6.03%
    Volume : $1,167,226,831.00
    Marketcap : $36,049,903,888.00
  • cardanoCardano(ADA)
    $0.4512.42% 24H
    CARDANO
    24H : 2.42%
    Volume : $899,480,486.00
    Marketcap : $15,377,404,353.00
  • rippleXRP(XRP)
    $0.3141.72% 24H
    XRP
    24H : 1.72%
    Volume : $1,410,337,806.00
    Marketcap : $15,252,649,999.00
  • terra-lunaTerra Luna Classic(LUNC)
    $0.000071-5.36% 24H
    TERRA LUNA CLASSIC
    24H : -5.36%
    Volume : $134,961,670.00
    Marketcap : $768,841,921.00
Coinscreed
No Result
View All Result
Home Bitcoin News

Bitcoin Hits $30,000, Is The Coin On The Way To Recovery?

Chosen Esiwe by Chosen Esiwe
1 month ago
in Bitcoin News
Reading Time: 3 mins read
A A
Share on FacebookShare on Twitter

Bitcoin was trading at $30,000 at the time of writing. The coin held its resistance at $28,000 as the bears came to the rescue.

Bitcoin Hits $30,000, Is The Coin On The Way To Recovery? | Coincreed
BTC

For the past 24 hours, Bitcoin has attempted to break out of its consolidation. For the consolidation to be invalid, it must trade above the $31,000 price level.

SuggestedArticles

List of top 10 Bitcoin and blockchain books to learn about blockchain technology

List of top 10 Bitcoin and blockchain books to learn about blockchain technology

4 days ago
Bitcoin Miners Sold All Their May Harvest – Report Reveals

Bitcoin Miners Sold All Their May Harvest – Data Shows

1 week ago

As usual, sideways movement can lead to a breakout case. Bitcoin indicators on the one-day chart are looking positive. In the last 24 hours, BTC is up 4.6%, and over the past week, there has been a 0.8% appreciation.

Despite a positive outlook on the one-day chart, there is a possibility of a downside break. The global cryptocurrency market cap today was $1.33 trillion, with a positive change of 3.8% over the last 24 hours.

Bitcoin Price Analysis: One-Day Chart

Bitcoin Hits $30,000, Is The Coin On The Way To Recovery? | Coincreed
Bitcoin was priced at $30,000 on the one-day chart.

Kingcoin was trading at $30,542 at press time. After trading near its tight $28,000 support line, the coin broke through the $29,000 level.

The currency’s overhead resistance stood at $31,000 and if the bulls continue the momentum, the coin could attempt to trade near $34,000.

Another resistance level came in at $36,000 and then $37,000. The volume of the currency has increased, which is related to the upward movement.

The volume bar was green at the time of writing, which also indicates increased buying pressure. Despite Bitcoin painting the coin bullish, it formed a descending triangle.

A descending triangle is associated with bearish price action, so it cannot be said with certainty that the currency would move higher.

Technical Analysis
Bitcoin Hits $30,000, Is The Coin On The Way To Recovery? | Coincreed
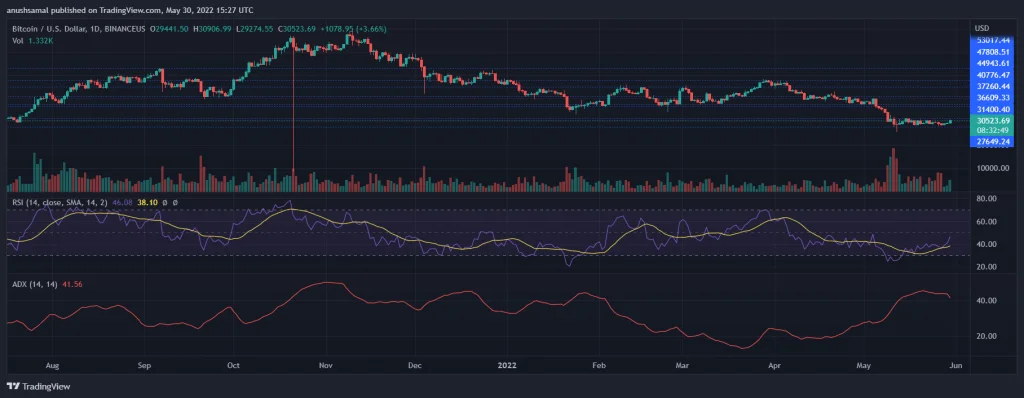
Bitcoin registered a rise in buying strength on the one-day chart.

Bitcoin was showing bullish signals on the one-day chart. The Relative Strength Index rallied on the chart, the indicator moved north near the 50 line.

This read meant buyers were returning to the market and signified increased demand, indicating upward pressure.

The Average Directional Index shows the directional trend of the currency. The ADX parked above the 40 level, indicating a strong current trend.

However, the ADX showed a downward tick and this could mean that the momentum of the current price is fading, indicating a change in the momentum of the current price.
Bitcoin Hits $30,000, Is The Coin On The Way To Recovery? | Coincreed
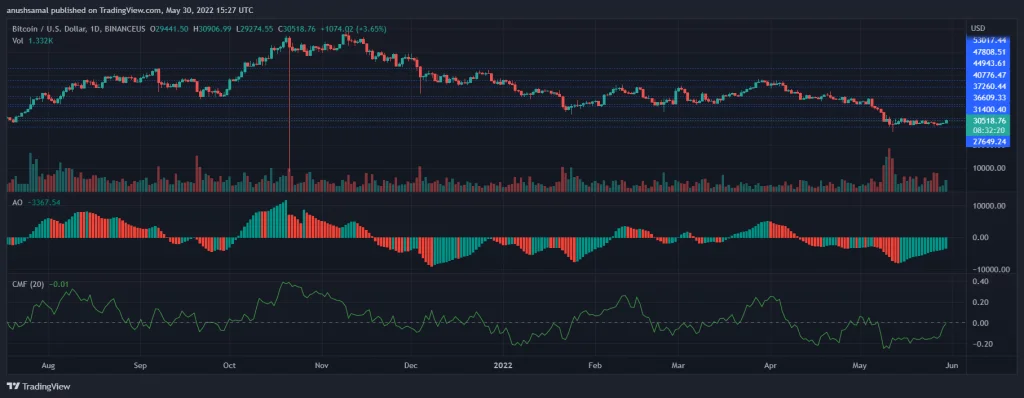
Bitcoin flashed a buy signal on the one-hour chart.

Awesome Oscillator showed green histograms. The indicator represented market dynamics and showed an upward trend. AO also showed buy signals on the one-day chart.

This matched the Relative Strength Index as the indicator rose near the midline. Chaikin Money Flow determines capital inflows and outflows.

The indicator was hovering near the midline as capital flows had recovered at the time of writing.

However, it is uncertain whether BTC will trade according to the indicators as the coin also hints at a possible price drop.

GXGBET
Coinscreed

Copyright © 2022 Coinscreed

Navigate Site

  • About
  • Advertise
  • Privacy & Policy
  • Crypto Price Charts

Follow Us

No Result
View All Result
  • News
    • Bitcoin News
    • Ethereum News
    • Ripple News
    • Litecoin News
    • Altcoin News
    • DeFi
    • Blockchain News
  • Market Analysis
  • NFT
  • Metaverse
  • Cryptocurrencies
  • Learn
    • Bitcoin 101
    • Ethereum 101
    • Binance Smart Chain
    • DeFi 101
    • Ripple 101
    • ICO 101
    • Trading 101
    • Dogecoin 101
    • Lightening Network
    • NFT 101
  • Crypto How Tos

Copyright © 2022 Coinscreed

This website uses cookies. By continuing to use this website you are giving consent to cookies being used. Visit our Privacy and Cookie Policy.
Go to mobile version