Ethereum Classic has toppled the upper trendline of its symmetrical, thereby setting a possible 85% surge in motion

Ethereum Classic Toppled
The upper trendline of Ethereum Classic’s symmetry has been toppled, potentially triggering an 85 percent rally.
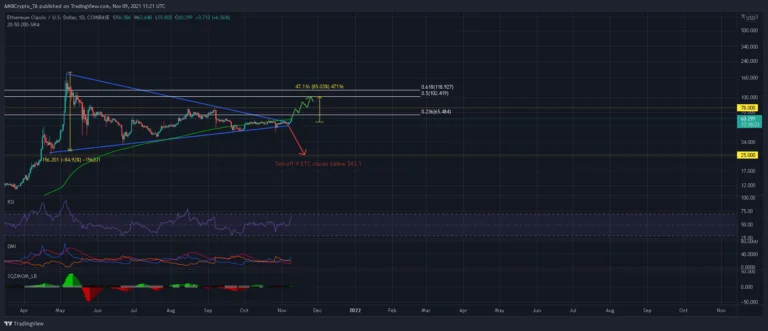
A daily closure above the 200-day moving average (green) would assist confirm a sustained rise all the way to the 50% Fibonacci milestone at $103.6.
After that, an overbought RSI could cause a short drop before ETC resumes its march toward its local high in May. ETC was trading at xx at the time of publication.
Ethereum Classic Analysis

Following an amazing start to 2021 and a 1,550 percent percentage spike between late March and early May, Ethereum Classic’s symmetrical triangle has been forming for about 5 months.
ETC expected a jump of 85 percent from the breakout point based on the pattern’s greatest and lowest peaks.
After ETC had two green candles above the upper trendline, the next move was to bullishly overturn the 200-SMA (green) to jumpstart the rise.
After successfully negotiating past some sell pressure at $78.08, ETC would go on to the 50 percent Fibonacci level at $103.6 if it closes above this long term moving average line decisively.
Bears would have to close below the low of $43.1 on October 27 to cause a breakdown. ETC would be vulnerable to a huge sell-off towards late-April levels near $25 in this scenario.
However, if the overall market continues to be risk-on, this seems improbable.
Reasoning
A bullish RSI that traded over 65 supported ETC’s upside potential.
In the short term, ETC could potentially extend gains beyond the 23.6 percent Fibonacci level until a slight drop is triggered by an overbought RSI.
Following a bullish crossover between the +DI and -DI lines, the Directional Movement Index flashed a buy signal.Meanwhile, the Squeeze Momentum Indicator remained neutral-biased and had failed to reveal a distinct direction.
Expect this to change once the market experiences a “squeeze release” and volatility increases.
Conclusion
Following a symmetrical triangle breakout, ETC aimed for an 85 percent rise. The RSI and DMI both supported a bullish forecast.
After pushing through sell pressure around $78 and closing above its 200-SMA (green), ETC could make progress towards its target at the 50 percent Fibonacci level.
