Unlocking the potential of crypto trading requires a strategic approach, and technical analysis is a powerful tool in your arsenal. This guide will let you know how to use technical analysis to improve your crypto trading.

What is Technical Analysis?
Technical analysis involves analyzing historical price and volume data to predict future market movements. It helps traders identify trends, patterns, and key levels for making informed trading decisions in the crypto market.
Key Principles of Technical Analysis
Here are the main principles of technical analysis:
- Price patterns
- Trends
- Support and resistance levels
- Indicators
Price patterns
Price patterns can be broadly categorized into the following groups:
- Continuation patterns
- Reversal patterns
- Consolidation patterns
- Volatility patterns
- Candlestick patterns
Continuation Patterns
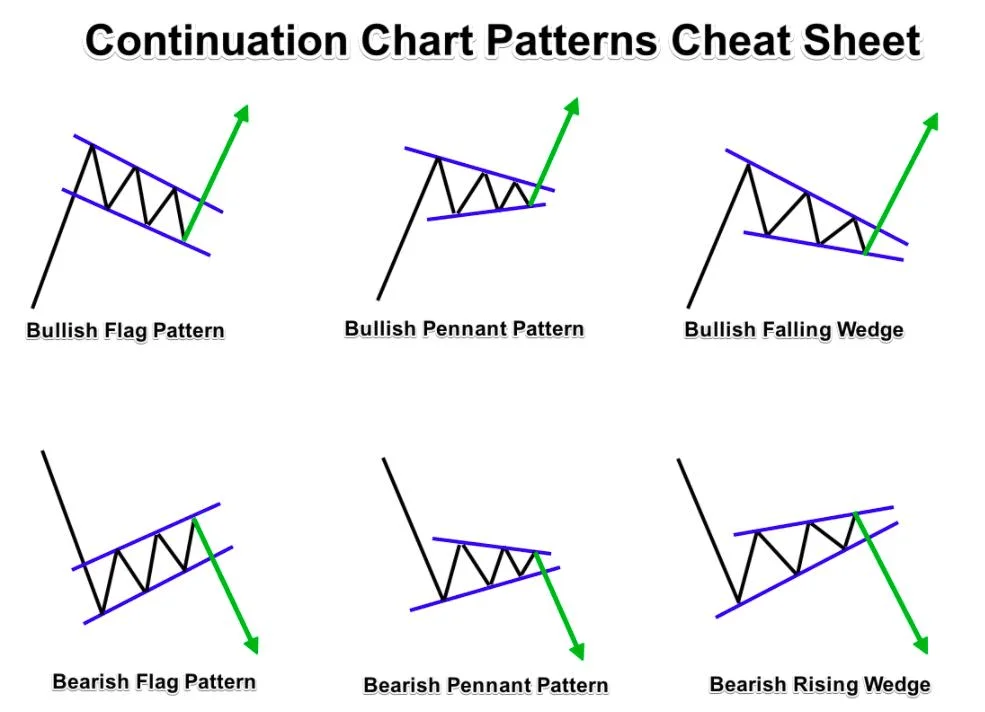
These patterns suggest that the prevailing trend continues after a period of consolidation. Examples include flags, pennants, rectangles, and wedges. Traders look for breakouts from these patterns to confirm the continuation of the existing trend.
Reversal Patterns
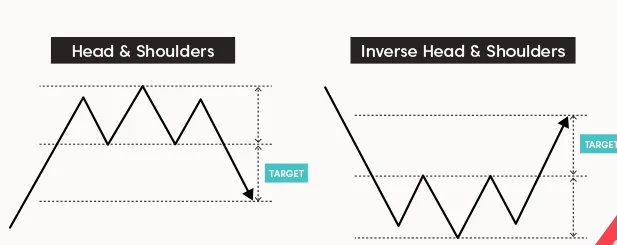
Reversal patterns indicate a potential change in the direction of the current trend. Traders use these patterns to identify possible trend reversals and adjust their trading strategies accordingly. Examples include double tops, double bottoms, head and shoulders, and harami.
Consolidation Patterns
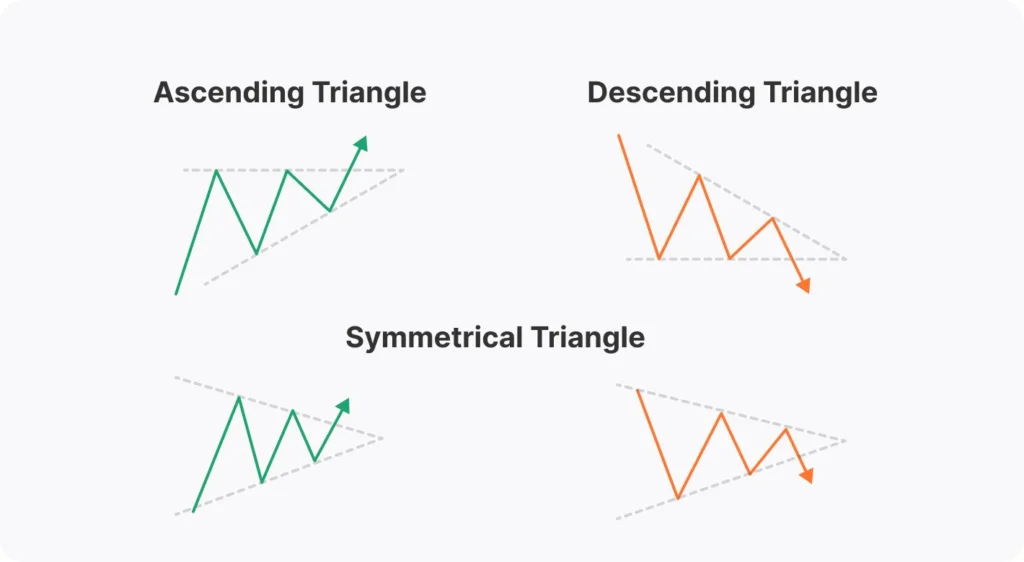
Consolidation patterns occur when the price moves within a range, indicating a period of indecision and lack of a clear trend. These patterns often precede a significant price move. Examples include rectangles, triangles, and pennants.
Volatility Patterns
Volatility patterns suggest an increase or decrease in market volatility. These patterns can provide insights into potential price breakouts or trend reversals. Examples include the widening or narrowing of Bollinger Bands, sudden spikes in volatility, or rapid contraction of price ranges.

Candlestick Patterns
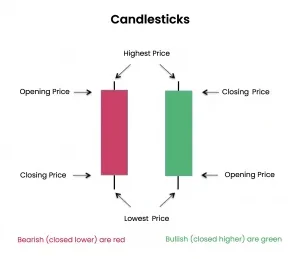
Candlestick patterns are formed by the arrangement of individual candlesticks on a price chart. These patterns provide insights into market sentiment and can indicate potential reversals or continuations. Examples include doji, engulfing patterns, hammers, shooting stars, and morning/evening stars.
Trends
Identifying and riding trends, including uptrends, downtrends, and sideways movements, allows traders to align their strategies with the market direction.
Support and resistance levels
Determining price levels where buying or selling pressure is significant helps traders identify potential entry and exit points.
Indicators
Tools like moving averages, relative strength index (RSI), moving average convergence divergence (MACD), and Fibonacci retracement provide additional insights into market trends, momentum, and potential reversals.
Key Technical Analysis Tools for Crypto Trading
- Moving averages
- Relative Strength Index (RSI)
- Moving Average Convergence Divergence (MACD)
- Fibonacci Retracement
Moving Averages
Moving averages calculate the average price over a specific period to smoothen fluctuations. They help identify trend directions, entry and exit points, and potential support/resistance levels.
Relative Strength Index (RSI)
The RSI measures the speed and change of price movements. It helps identify overbought and oversold levels, indicating possible reversals or market exhaustion.
Moving Average Convergence Divergence (MACD)
The MACD combines moving averages to identify momentum and trend changes. Traders use signal line crossovers and histogram patterns to generate buy or sell signals.
Fibonacci Retracement
Fibonacci retracement applies Fibonacci ratios to identify potential support and resistance levels. Traders draw Fibonacci retracement levels on charts to determine possible price reversals.
Analyzing Price Patterns and Trends
Price patterns
Common Price Patterns in Crypto Trading:
- Triangles
- Head and shoulders
- Double tops/bottoms
- Flags
Triangles
Symmetrical, ascending, and descending triangles indicate potential breakouts.
Head and Shoulders
This reversal pattern consists of a peak (head) and two smaller peaks (shoulders).
Double Tops/Bottoms
These patterns indicate potential trend reversals
Flags
Flags are continuation patterns that appear after sharp price movements.
Trend Analysis
There are three types of trends
- Uptrends
- Downtrends
- Sideways movements
By drawing trendlines and using moving averages, traders can determine the direction of the trend. Different strategies are employed for trading in each type of trend.

Support and Resistance Levels
Understanding Support and Resistance Levels
Support levels are price levels where buying pressure is significant, while resistance levels are those where selling pressure is substantial. Traders identify key levels using horizontal lines and trendlines.
Utilizing Support and Resistance Levels
- Entry and exit points
- Stop loss orders
- Breakouts and pullbacks
Entry and exit points
Buying near support and selling near resistance can improve trading outcomes.
Stop-loss orders
Placing stops below support or above resistance helps manage risk.
Breakouts and pullbacks
Identifying breakout or pullback opportunities around key levels improves trade timing.
Technical Indicators and Oscillators
Popular Technical Indicators
Some popular technical indicators include:
- Moving Average Convergence Divergence (MACD
- Relative Strength Index (RSI)
- Bollinger Bands
- Stochastic Oscillator
- Volume
Moving Average Convergence Divergence (MACD)
This indicator identifies momentum and trend changes, helping traders make informed decisions.
Relative Strength Index (RSI)
The RSI gauges overbought or oversold conditions, providing insights into potential reversals.
Bollinger Bands
Bollinger Bands consist of a moving average and two standard deviation bands. They help traders identify high or low volatility periods, potential price breakouts, and overbought or oversold conditions.
Stochastic Oscillator
The stochastic oscillator compares a cryptocurrency’s closing price to its price range over a specified period. It helps traders identify overbought or oversold conditions and potential trend reversals.
Volume
Volume is an essential indicator measuring the number of shares or contracts traded within a specified period. Analyzing volume can provide insights into market strength and confirm price movements.
Incorporating Risk Management in Technical Analysis
The Importance of Risk Management
Effective risk management is crucial for successful crypto trading. While technical analysis provides valuable insights, it should be complemented by proper risk management strategies to protect capital and minimize losses.
Risk Management Strategies
- Position Sizing
- Stop-Loss Orders
- Risk-to-Reward Ratio
- Emotional Management
Position Sizing
Determine the appropriate position size based on your risk tolerance and the trade’s potential risk/reward ratio. This ensures that no single transaction excessively impacts your overall portfolio.
Stop-Loss Orders
Set stop-loss orders to automatically exit a trade if the price reaches a predetermined level. This helps limit potential losses in case the market moves against your position.
Risk-to-Reward Ratio
Assess the potential reward with the potential risk before entering a trade. A favorable risk-to-reward ratio ensures that potential profits outweigh potential losses.
Emotional Management
Control emotions like fear and greed, which can lead to impulsive trading decisions. Stick to your trading plan and avoid making emotionally driven trades.
Conclusion
Technical analysis is a powerful tool for improving your crypto trading skills. You can make more informed trading decisions by understanding the basics, utilizing essential tools and indicators, analyzing price patterns and trends, and incorporating risk management strategies.
Remember to practice and refine your technical analysis skills, focusing on technical and fundamental factors influencing the crypto market. Continuously educate yourself and successfully adapt your strategies to navigate the ever-changing crypto landscape.
Remember, mastering technical analysis takes time and experience. Embrace a learning mindset, experiment with different strategies, and stay disciplined. With dedication and practice, technical analysis can significantly enhance your ability to trade cryptocurrencies effectively.
