With 56% of holders becoming profitable, transactions increasing, and whale accumulation, Chainlink ($LINK) demonstrates robust growth.

Chainlink ($LINK) is capitalizing on the positive market sentiment by demonstrating exceptional durability and financial success.
Meanwhile, a current profitability rate of 56% among $LINK holders is consistent with that of other prominent cryptocurrencies.
This signifies a departure from the bear market’s grasp, during which, over a year ago, 70% of holders experienced losses.
Chainlink enthusiasts view the current state of affairs as one of recovery and optimism.
Whale Activity and Transaction
Recent IntoTheBlock data indicates that the Chainlink network is experiencing transactional solid health, as daily transactions have increased by 436% since their monthly lows.
This increase is not merely numerical; the volume of transactions also reflects this favorable trend.
Since July 2022, the daily on-chain transaction volume of Chainlink has remained stagnant at $515 million.
Moreover, whale activity provides additional support for Chainlink’s optimistic narrative.
In the past month, large holders, who control over 1% of the supply, have amassed more than 52 million LINK.
The substantial net accumulation signifies a firm conviction in the worth and prospects of Chainlink, thereby augmenting the optimistic sentiment of the market.
The Technical Front
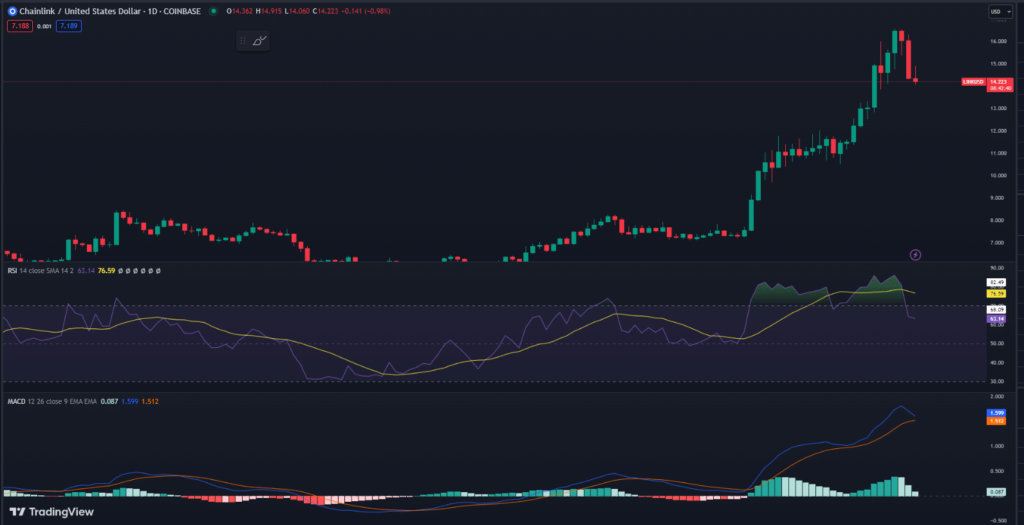
A nuanced depiction of the market dynamics of Chainlink (LINK) against the US Dollar (USD), as traded on Coinbase, was revealed in a recent technical analysis.
At $14.32, the current price movement of LINK signifies a favorable trajectory distinguished by a substantial increase in value.
Nevertheless, indications of a possible reversal or pullback are present in this ascent, as a red candlestick appeared during the most recent trading session.
This signifies a momentary halt or slowdown in the bullish momentum.
An examination of particular indicators reveals that the Relative Strength Index (RSI) is greater than 60.
Although this level signifies robust bullish momentum, it is critical to acknowledge that the RSI has recently deviated from the overbought region situated above 70.
This retreat may indicate impending selling pressure, which is a frequent phenomenon following significant price increases in the market.

The Moving Average Convergence Divergence (MACD) provides additional evidence to favor this analysis.
Currently, the MACD, which is situated above the signal line, signifies the presence of dominant bullish momentum.
Upon closer examination of the histogram, it becomes evident that this momentum diminishes as the bars enlarge.
Generally, this pattern indicates that the favorable trend is waning in momentum.
