Bitcoin and other major cryptocurrencies are struggling to generate bullish momentum, which could indicate that prices will continue to fall

Bitcoin (BTC) and the majority of big cryptocurrencies remain trapped below their respective overhead resistances, indicating that bears are selling on rallies.
“Whales are depositing Bitcoin to exchanges,” says Ki Young Ju, CEO of on-chain analytics firm CryptoQuant. Surprisingly, outflows from exchanges have also continued, and as a result, reserves remain near their lowest levels since mid-2018.
Glassnode stated in a slightly contradicting study that long-term holders may be “cutting their expenditure, and hence are more likely to be adding to positions, rather than abandoning them.”
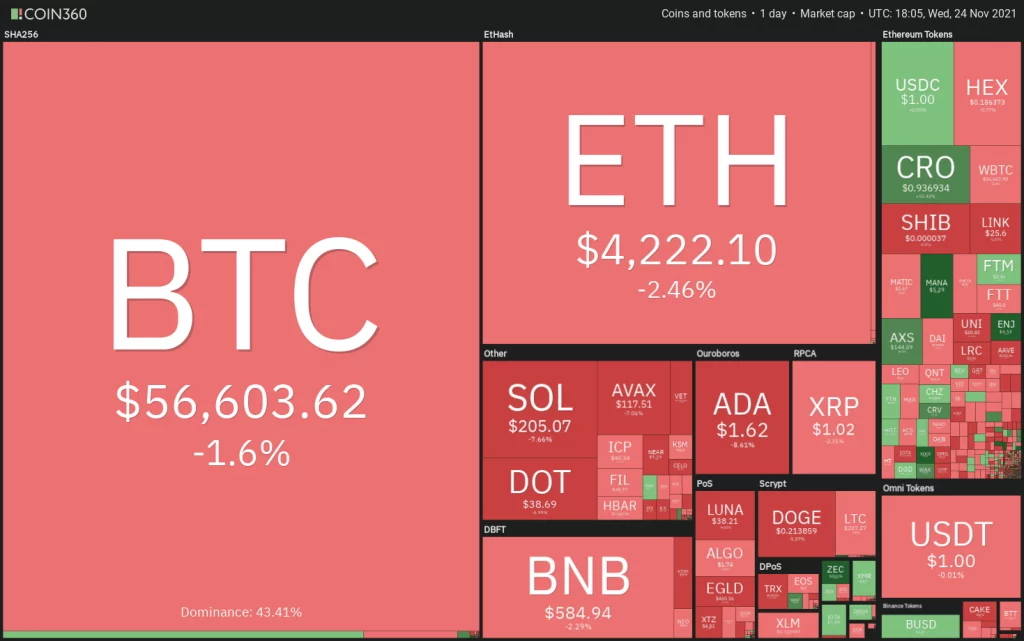
While Bitcoin has been on a downward trend in dollar terms, it has proven to be a buying power rescuer for Turkish investors. While the lira continues to fall in value in 2021, Bitcoin in lira terms has been consistently reaching new all-time highs, crossing 700,000 lire on Nov. 23.
BTC/USDT
The bulls are attempting to halt the correction near $55,000, but the bears are unyielding. Bitcoin’s relief rally on November 23 reversed from $58,000, indicating that bears are attempting to convert this level into resistance.
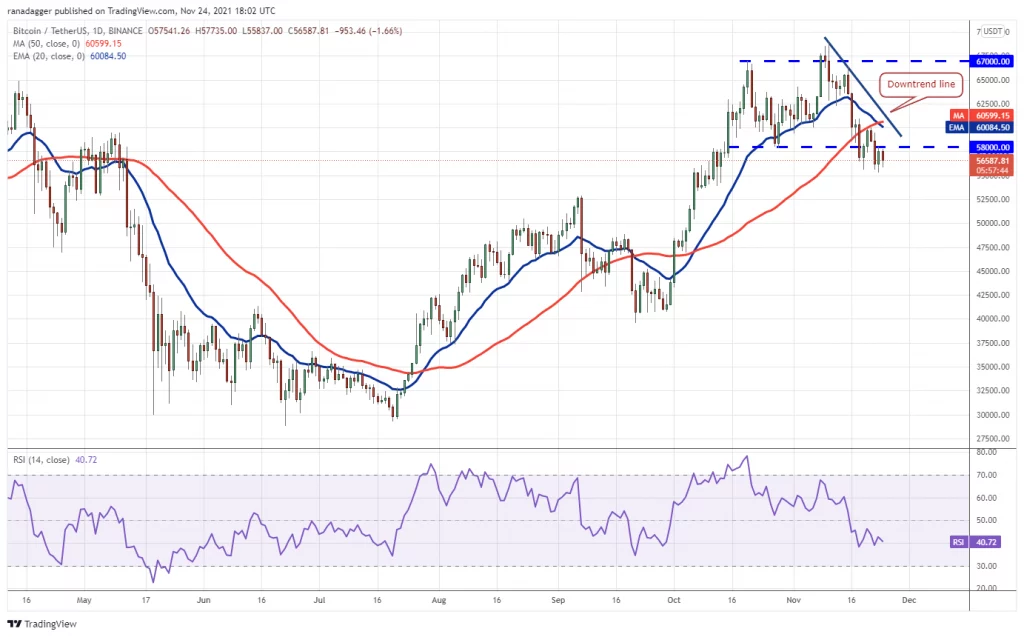
The moving averages have completed a bearish crossover, and the relative strength index (RSI) remains in negative territory, indicating that bears have the upper hand.
If the price falls below $55,317, selling may become more intense, and the BTC/USDT pair may fall to the $52,500 to $50,000 support zone. The bulls will most likely defend this zone aggressively, but the subsequent rebound may be met with selling at the 20-day exponential moving average ($60,084).
This negative viewpoint will be rendered null and void if the price rises from its current level and breaks above the downtrend line. The pair could then try to resume its upward trend.
ETH/USDT
On Nov. 22, Ether (ETH) recovered from near the neckline of the developing head and shoulders (H&S) pattern. On Nov. 23, the rebound from the neckline reached the 20-day EMA ($4,337), which is acting as a strong resistance.
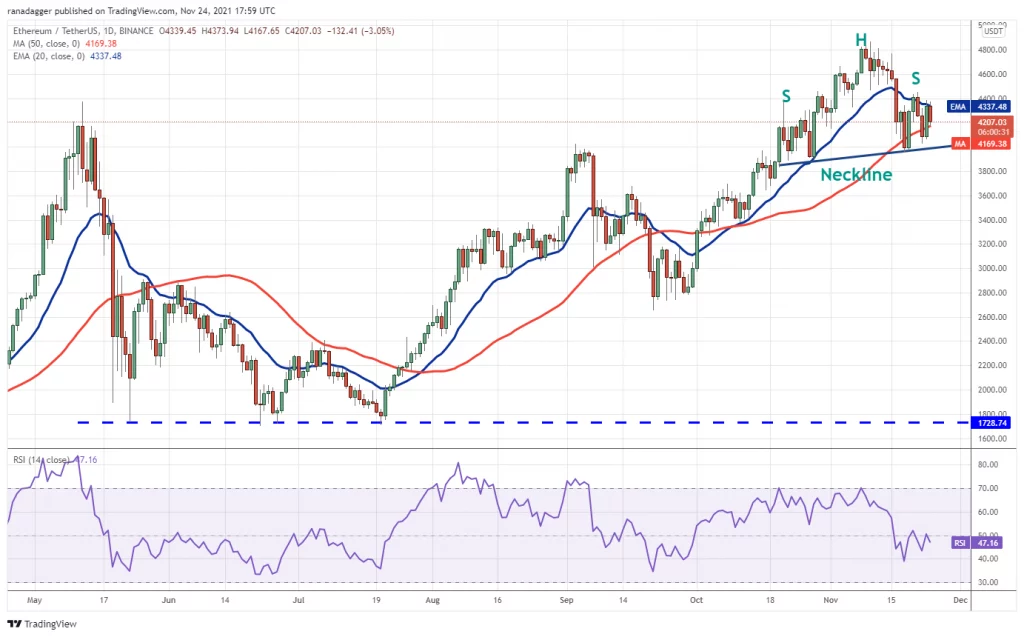
If the price falls from its current level and breaks below the 50-day simple moving average ($4,169), bears will try to pull the ETH/USDT pair below the neckline once more. If they succeed, the bearish pattern will be completed, with a target objective of $3,047.
In contrast, if bulls push the price above the 20-day EMA and resistance at $4,451, it will indicate that selling pressure is easing. The pair will then try to rally to the $4,772.01 to $4,868 overhead resistance zone. The return of the uptrend will be signaled by a break and closing above this zone.
BNB/USDT
Binance Coin (BNB) fell from $605.20 on November 21 to below the 20-day EMA ($584). However, the bears were unable to exploit this weakness and drive the price down to the 50-day simple moving average ($532).
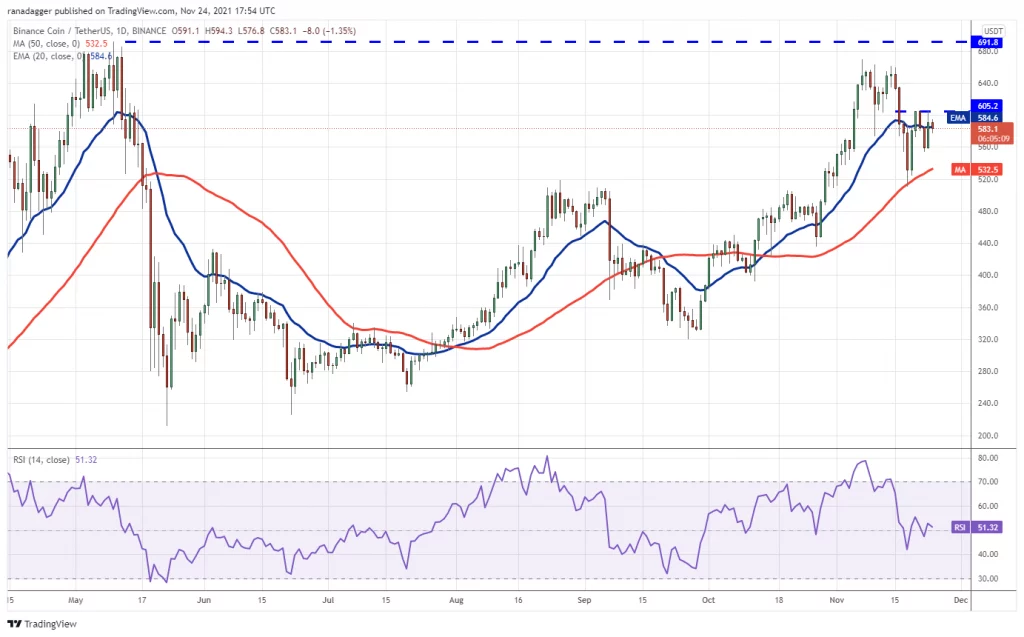
This suggests that bulls are gathering at lower levels. On Nov. 23, buyers attempted to break through the above barrier, but the bears defended it furiously once more. The price is currently trading near the 20-day moving average.
If the price rises from its current level and breaks above $605.20, the BNB/USDT pair may attempt to test the resistance level of $669.20. If this level is breached, the pair may retest its all-time high of $691.80.
If the price remains below the 20-day EMA, the bears will attempt to pull the pair back to the 50-day SMA. A break and closing below this support level might herald the start of a more serious decline.
SOL/USDT
On November 22, Solana (SOL) fell below the 20-day EMA ($219). On November 23, the bulls pushed the price back above this level, but they were unable to maintain the higher levels. This suggests that bears are defending the 20-day moving average.
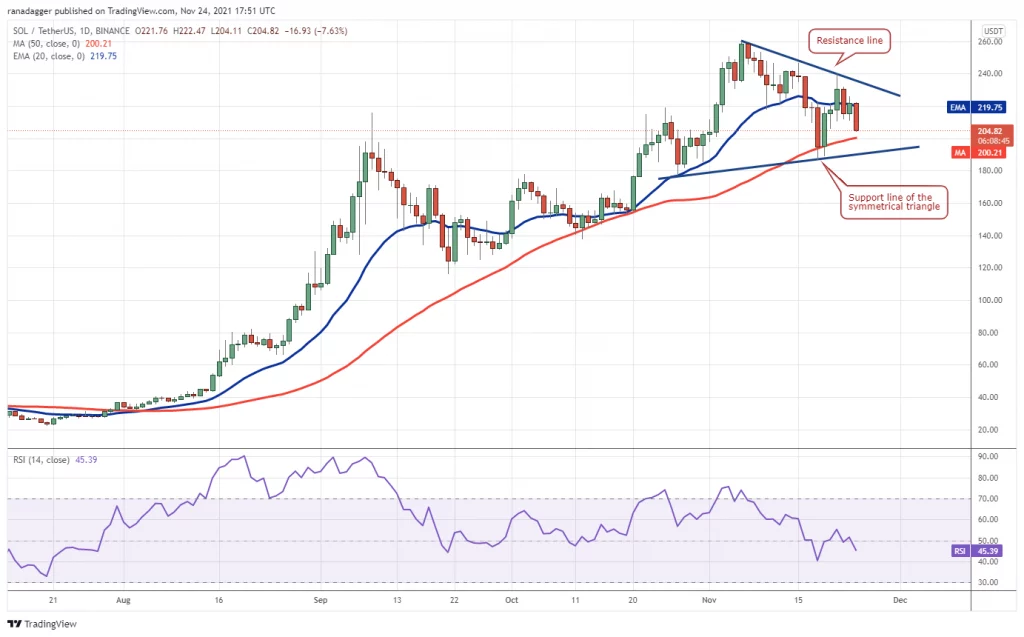
The bears will now attempt to pull the price down to the symmetrical triangle’s support line. This is an important level for the bulls to defend because a break below it could tip the scales in the bears’ favor. The SOL/USDT pair might then begin to fall, first to $153 and subsequently to $140.
Alternatively, if the price rises and breaks over the resistance line, it will indicate that the bulls have won. The pair could then rally to an all-time high of $259.90, where the bears are likely to put up a strong fight.
ADA/USDT
Cardano (ADA) fell from the 20-day EMA ($1.90) on Nov. 21, and the bears have now dragged the price below the important support level of $1.70. If bears keep the price below $1.70, the selling pressure may increase.
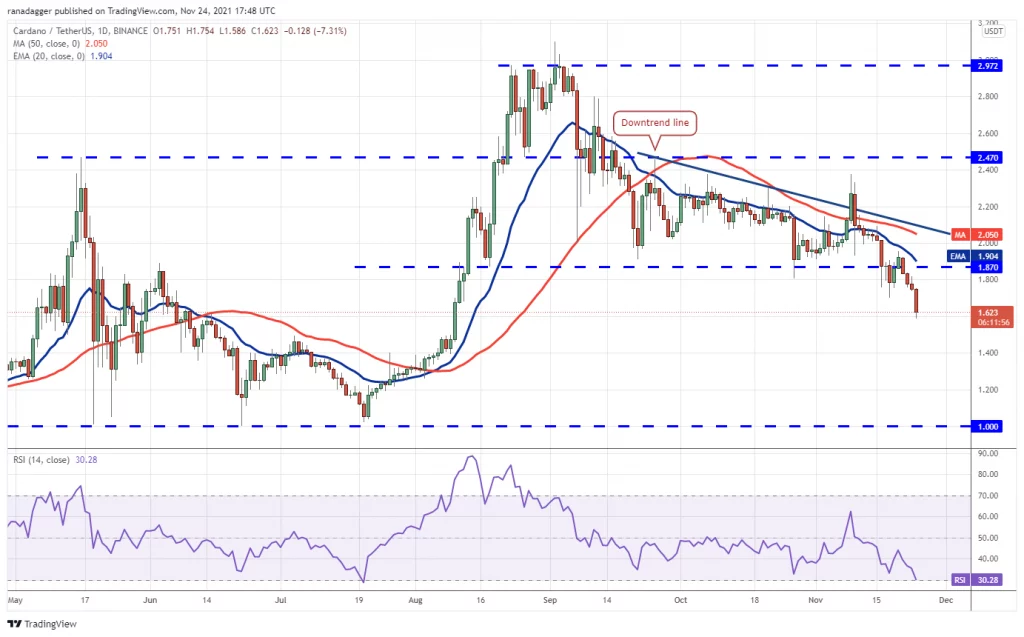
The bears are in charge, as seen by the downsloping moving averages and the RSI nearing the oversold zone. The ADA/USDT pair may potentially fall to the strong support level of $1.50, where buyers are expected to enter.
On the upside, the bulls will need to lift the price above the 20-day EMA and keep it there in order to suggest that selling pressure is easing. On a break and closure above the downtrend line, the trend may shift in favor of the bulls.
XRP/USDT
On Nov. 23, XRP recovered from psychological support at $1, but the bulls were unable to push the price to the 20-day EMA ($1.10). The modest bounce suggests that bears will continue to sell on any minor relief rally.
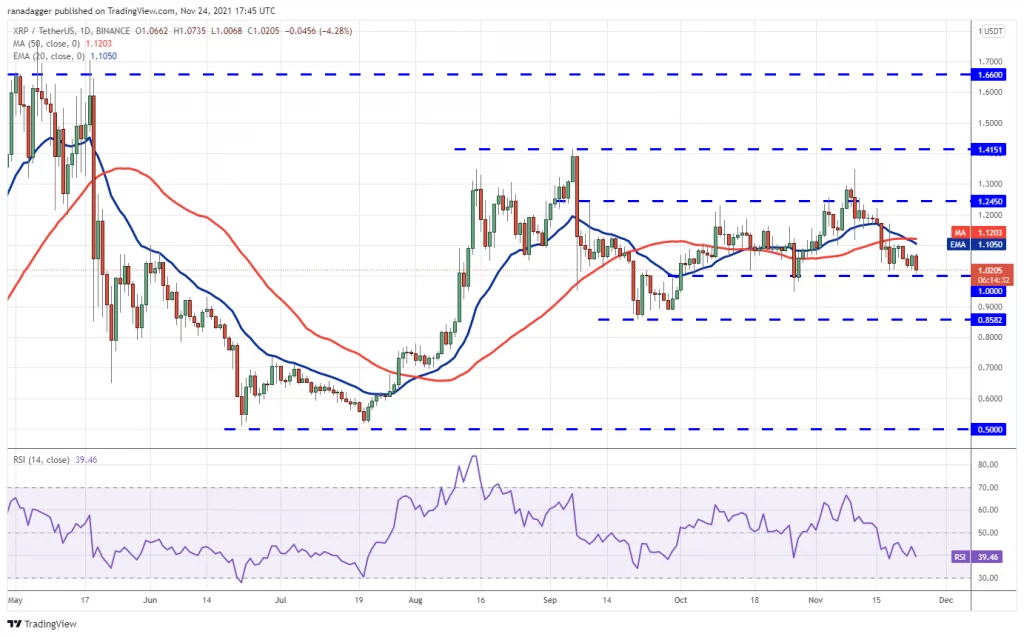
The bears will try to fall and hold the price below the solid support at $1 once more. If they are successful, the selling might accelerate and the XRP/USDT pair could fall to the important support level of $0.85.
The 20-day EMA is sloping downward, and the RSI is in the negative zone, indicating that the path of least resistance is to the downside. If the price increases and breaks above the 50-day simple moving average ($1.12), this bearish view will be invalidated. This could pave the way for a rally to $1.24.
DOT/USDT
Polkadot (DOT) bounced off the uptrend line on November 23, but the bulls were unable to maintain the higher levels. The price has once again dropped to the uptrend line.
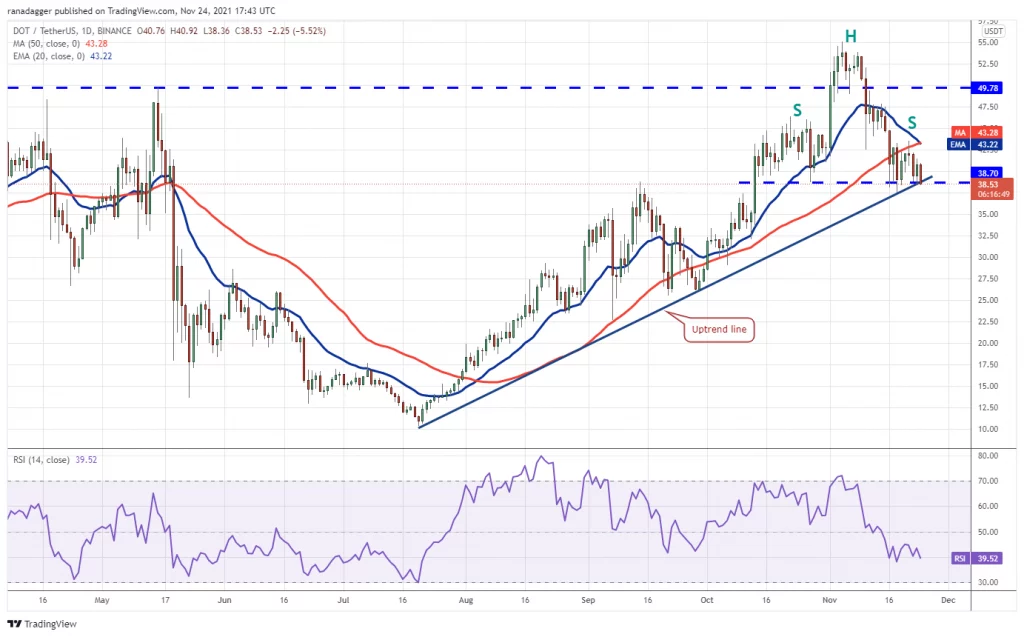
The frequent retesting of a support level weakens it. Moving averages have completed a bearish crossover, and the RSI is below 40, indicating that bears are in charge.
If the price falls below $37.53 and closes below it, the DOT/USDT pair will complete a bearish H&S pattern. After that, the pair could begin a deeper correction toward $26.
If the market returns from its current level, the bulls will make one more effort to break through the $43.56 barrier. If they succeed, it will indicate that the sellers’ hold on the market is slipping.
DOGE/USDT
On November 23, Dogecoin (DOGE) recovered off the important support level of $0.21, but the lengthy wick on the day’s candlestick implies that bears are still selling along the downtrend line.
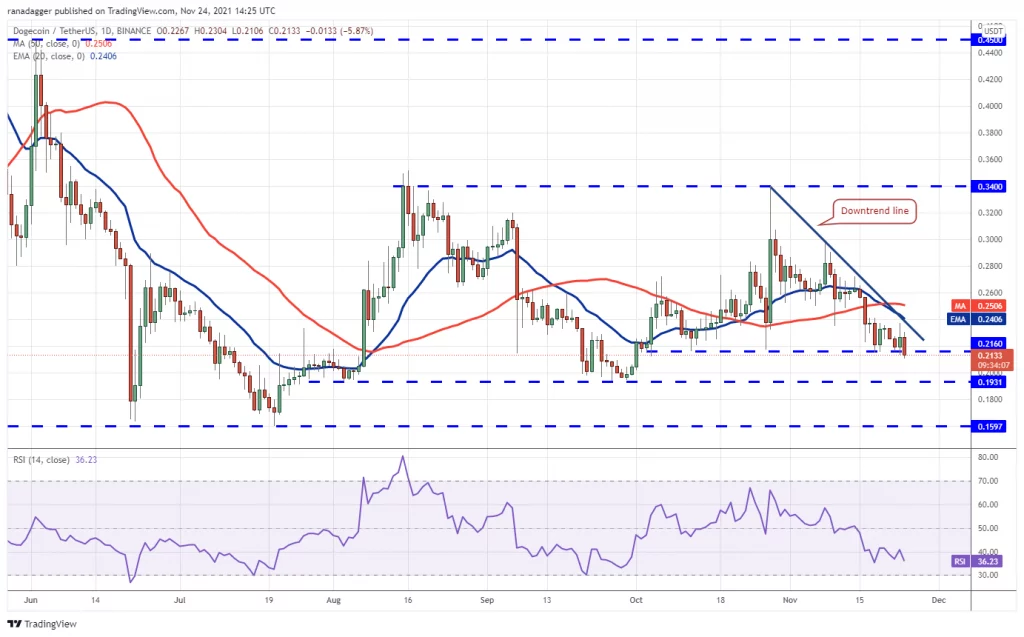
The DOGE/USDT pair fell below the $0.21 support level today, and the bears will now try to push the price down to the important support level of $0.19. This is critical support for the bulls to protect because if it fails, the pair might fall under $0.15.
The bears have the upper hand, as seen by the downsloping 20-day EMA ($0.24) and an RSI below 37. A break and closure above the downtrend line will be the first sign of strength. The bulls may make a comeback as a result of this.
AVAX/USDT
On Nov. 22, the bulls were unable to push Avalanche (AVAX) beyond the all-time high of $147, signaling that bears are actively defending the overhead barrier. Short-term traders may have profited as a result of this.
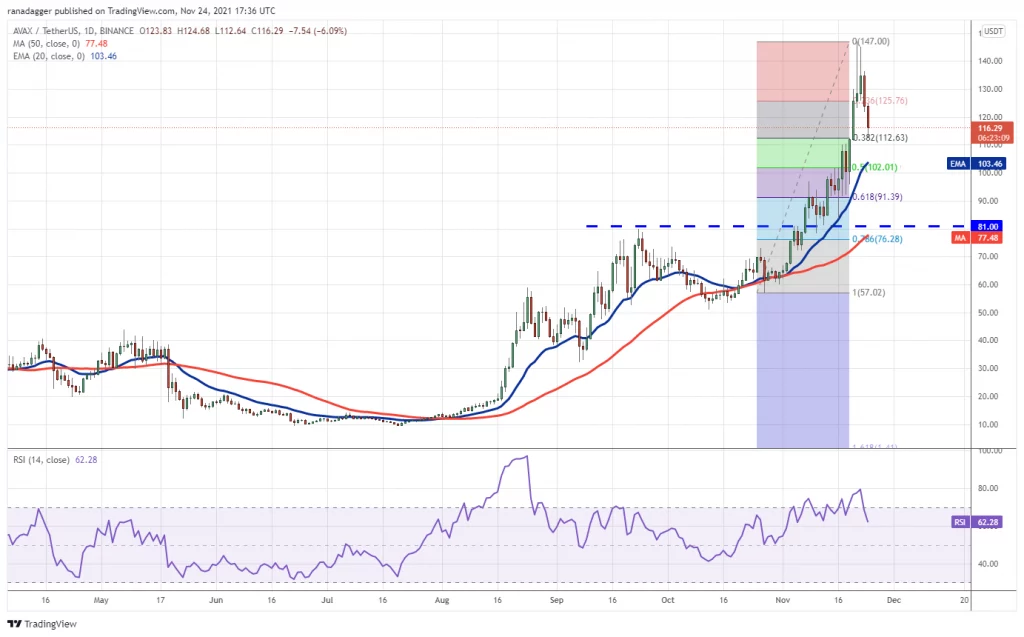
The AVAX/USDT pair has begun a pullback that should find solid support between the 38.2% Fibonacci retracement level at $112.63 and the 20-day EMA ($103).
If the price bounces off this level, it indicates that sentiment is still favorable and traders are buying on dips. The bulls will then make one last push to take the pair above the all-time high and restart the uptrend.
A break and closure below the 20-day EMA, on the other hand, indicates that supply exceeds demand. The pair could then fall to $91.39, the 61.8 percent Fibonacci retracement level.
CRO/USDT
For the past few days, Crypto.com Coin (CRO) has been on a strong upswing. The vertical rally has pushed the RSI near to 90, indicating that the rally is currently overheated. For a few days, this could result in a mild correction or consolidation.
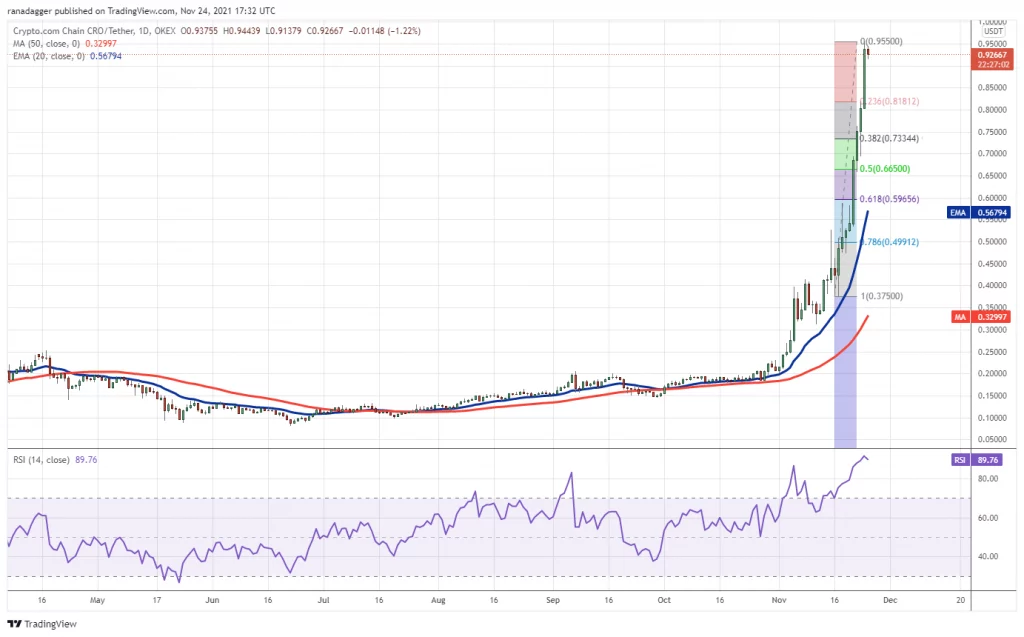
Profit-taking may occur near the psychologically significant threshold of $1. If this occurs, the CRO/USDT pair may begin to correct. The 38.2 percent Fibonacci retracement level at $0.73 is the first key support level on the downside.
Vertical rallies are typically followed by severe drops. If the price falls below $0.73, the correction could extend all the way to the 61.8 percent retracement level at $0.59. If the price bounces off $0.73, the bulls will make one more attempt to re-establish the uptrend.
HitBTC exchange provides market data.
