Following Shiba Inu’s recent price slide, conflicting technical setups emerge, with price targets as high as $0.0001

SHIB price falls further
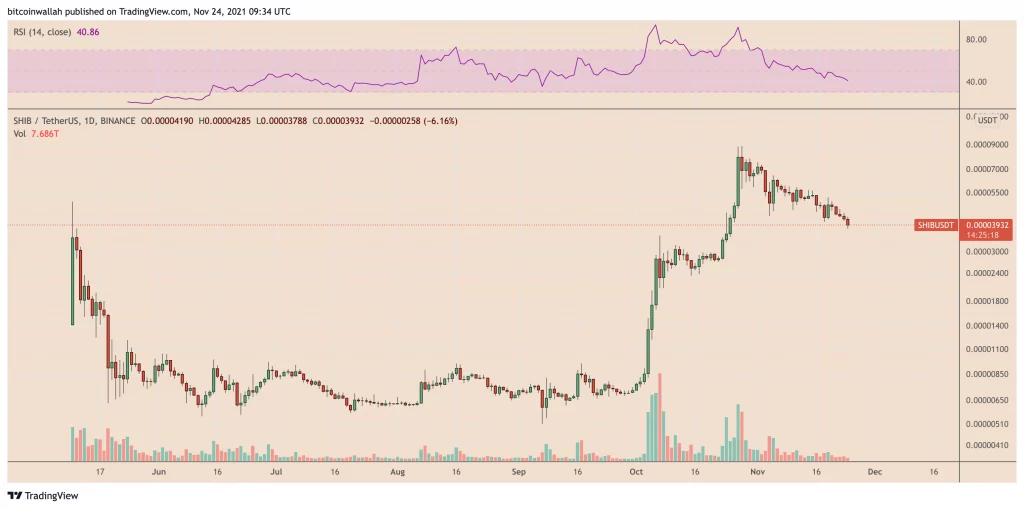
Shiba Inu (SHIB) fell further on Nov. 24 as its attractiveness among retail traders waned after it soared by more than 535 percent to a record high of $0.00008854 earlier this year.
SHIB’s price fell over 60% after hitting an all-time high on Oct. 28, indicating that traders have been actively locking in Shiba Inu profits. This has also resulted in a significant reduction in SHIB’s benchmark instrument of SHIB/USDT volumes on Binance, indicating a lack of retail interest.
As a result, SHIB’s estimated market value fell from about $28.31 billion to $21.30 billion in just five days commencing on Friday.

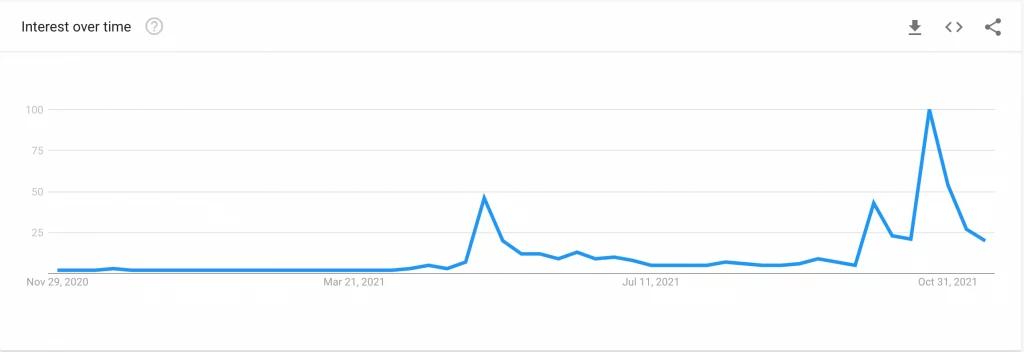
Google’s keyword search data also revealed a decline in interest in the “Shiba Inu” markets, with its 12-month timeframe score dropping from a perfect 100 to 20, in keeping with SHIB’s 60% price correction.

The falling Google Trends for the search “Shiba Inu,” according to Alex Krüger, an independent market expert, is an indication that the token has topped out — i.e., the beginning of its bear cycle.
Will there be another sell-off?
The most recent wave of selling in the SHIB market dropped its prices below a significant upward sloping support (the velvet trendline), indicating the possibility of more drops.
For example, as SHIB’s price trended lower, the levels specified within the scope of the Fibonacci retracement graph, drawn from a swing low of $0.00000614 to a swing high of $0.00008933, presented probable entry and exit opportunities, as seen in the chart below.
SHIB’s most recent price appears to have tested the 0.618 Fib line at $0.00003792 as an intermediate support level. SHIB’s ability to retest the upward sloping trendline as resistance, which corresponds with the 0.5 Fib line at $0.00004773, has increased following a rebound from the aforementioned price floor.
A move below $0.00003792, on the other hand, may push SHIB’s price to the 0.786 Fib line at $0.00002394. Using a weekly SHIB chart, market analyst IncomeSharks identified the area around $0.00002394 as a probable “buy zone.”
$SHIB – Think we see weekly supertrend support eventually touch. This is where I would look to get back in if I was to play this. pic.twitter.com/nBmtfB77n6— IncomeSharks (@IncomeSharks) November 23, 2021
SHIB price bull flag formation
The occurrence of a probable bull flag setup offsets the sell-off fears in the SHIB market.
Since peaking out at $0.00008854 on Oct. 28, SHIB’s price has been drifting lower within a downward sloping channel. As demonstrated in the chart below, the channel resembles a bull flag, a bullish continuation indicator that appears as a consolidation phase following a big rise upward.
Traders typically set their upside objective at a length equal to the height of the preceding upswing (referred to as a flagpole), hoping that the instrument will break above the flag range with stronger volumes. As a result, SHIB has the ability to rally by as much as $0.00005100, the height of its flagpole.
This puts the Shiba Inu token on track to reach $0.00010000.
