Bitcoin‘s recent rise above its 4-hour 20 SMA seems to pave the way for a possible comeback of other cryptocurrencies.

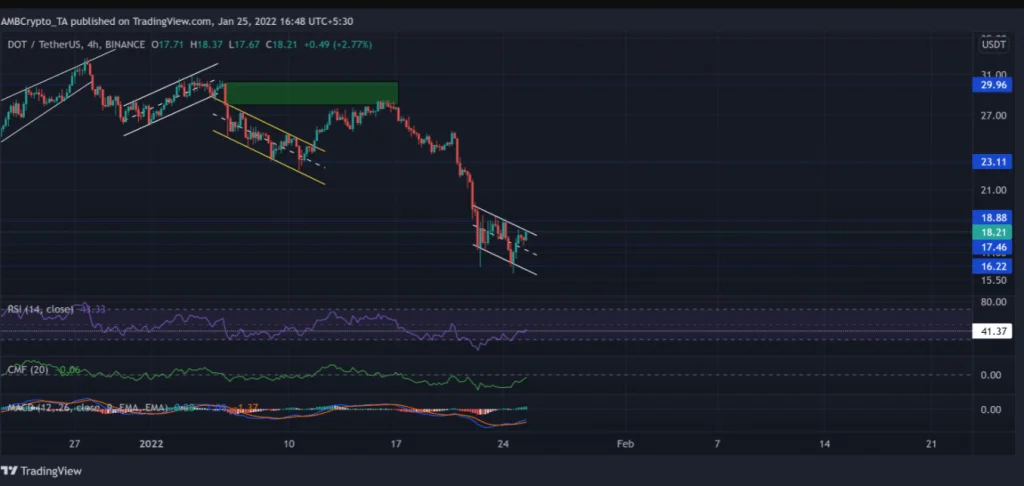
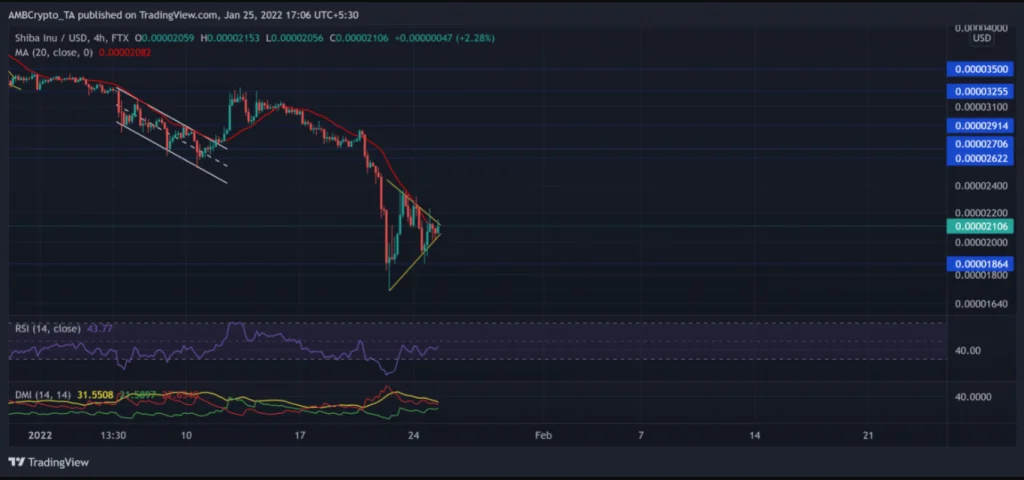
To confirm a reversal, Polkadot is required to test the down-upper channel’s trendline. Shiba Inu, on the other hand, formed a symmetrical triangle, but its near-term technicals showed mixed indications.
Polkadots (DOT)

For the past 11 weeks, the alt has been in a funk. The 5 January sell-off produced a strong supply zone (rectangle, green) for DOT when sellers stepped in at $29.96. Since then, the bears have taken control, breaching the five-month support level of $23.11. (now resistance).
The aftermath on January 21 caused a 38.34% drop, and the alt hurried to its 25-week bottom on January 24. The immediate resistance was now at the down-upper channel’s trendline. Then there’s the $18.8 threshold.
DOT was trading at $18.21 at the time of publication. The RSI was 43 at the time. It exhibited a strong recovery by surpassing the 41-mark after hitting the oversold zone. Furthermore, the CMF showed signs of improvement but had yet to pass the halfway point. The MACD also verified the prior analysis, but its histogram and lines indicated that selling pressure was lessening.
Shiba Inu (SHIB)

The down-channel (white) breakout failed to enter price discovery because the $0.00003255 resistance remained strong. The alt has been swaying below its 20 SMA since then (red). To top it off, the sell-off on January 21 witnessed a retracement of nearly 39.94 % till SHIB hit its 15-week low on January 22.
Then, as buyers came in around $0.00001864, it enjoyed a significant reverse bounce. On its 4-hour chart, the meme token now has a symmetrical triangle (yellow).
SHIB was trading at $0.00002106 at the time of publication, above its 20 SMA. After hitting a record low of 12.35, the RSI recovered back from the oversold zone. It improved by more than 30 points on the previous day, but it was still unable to pass the half-line. While the bulls began to rebound, the gap between the +DI and the -DI narrowed.
Curve DAO Token (CRV)

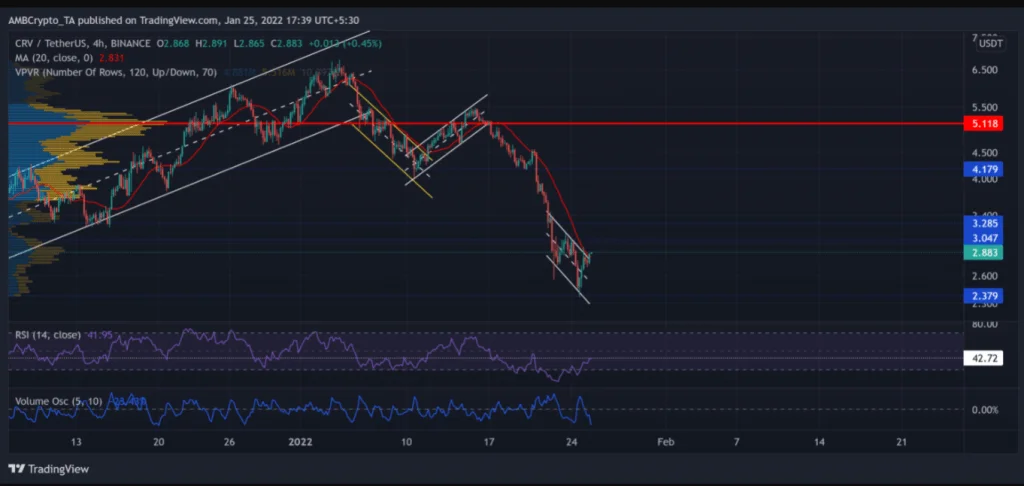
Since falling below its Point of Control (red), the sellers have increased their zeal and broken through the crucial $4.17 level. The most recent drop was a 47.4% retracement, reaching a 16-week low on January 24.
On its 4-hour chart, it has established a down-channel (white) over the last few days. The purchasing impact appeared to strengthen when the price soared above the 20 SMA (red) and broke out of the pattern.
CRV was trading at $2.883 at the time of publication. In the previous three days, the RSI has risen by more than 20 points. To prove a long-term turnaround, it needed to break over the 42-mark barrier. It’s also worth noting that the Volume Oscillator was southward during the current breakout, indicating a shaky bullish trend.
