Fantom (FTM) is approaching a key resistance level at $0.746, with a potential rally of over 15% if it breaks above. On-chain data and bullish indicators like MACD and RSI suggest strong upward momentum for FTM’s price.

The Fantom (FTM) price is on the brink of a critical resistance level, and it is expected to extend its gains on Tuesday. A solid close above this level could potentially sustain the rally. On-chain data further bolster the rally, as FTM’s Exchange Flow Balance exhibits a negative surge and high fee collection, suggesting that a rally is imminent.
The Price of Fantom Indicates the Possibility of a Rally
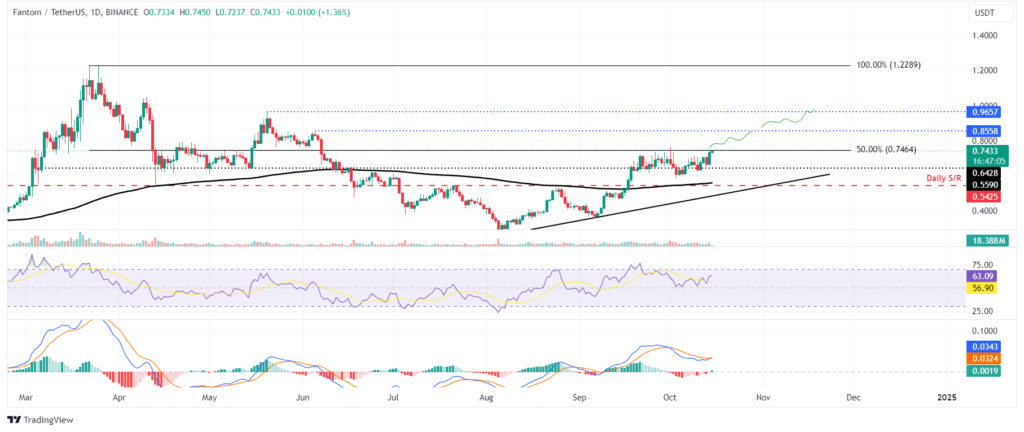
On September 17, Fantom’s price surpassed its 200-day Exponential Moving Average (EMA) at $0.558, increasing by more than 24% over the subsequent four days.
Following this rally, FTM was rejected from the 50% price retracement level, traced from the March high of $1.22 to the August low of $0.264, on multiple occasions, with a range of approximately $0.746. At the time of writing on Tuesday, it is steadily approaching the $0.746 mark.
FTM can increase by over 15% and retest its June 5 high of $0.855 if it breaks and closes above $0.746.
The daily chart is on the brink of a bullish crossover for the Moving Average Convergence Divergence (MACD) indicator. A buy signal would be generated if the MACD line (blue line) surpasses the signal line (yellow line). This implies that investors are in control, and the Fantom price may experience upward momentum.
Furthermore, the Relative Strength Index (RSI) on the daily chart is currently trading at 61, which is above its neutral level of 50 and remains far from the overbought condition. This suggests that there is bullish momentum and a potential for further growth in Fantom.

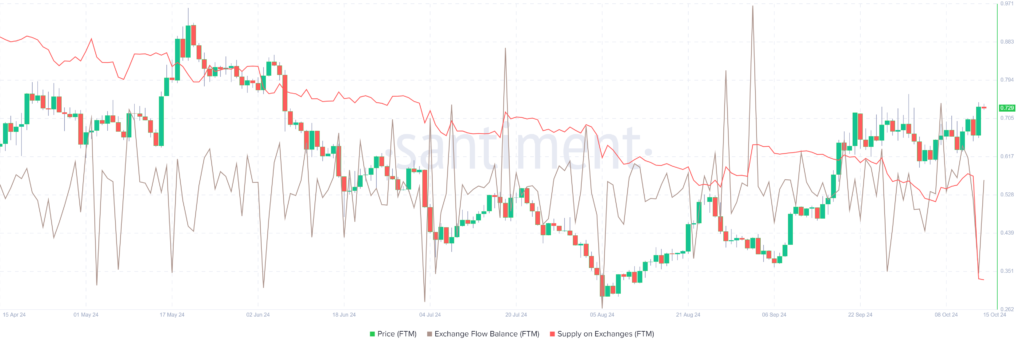
Fantom’s optimistic outlook is additionally bolstered by its on-chain metrics. Santiment’s Exchange Flow Balance metric represents the net movement of FTM tokens into and out of exchange accounts.
A rise in this metric suggests that more FTMs have entered the exchanges than have exited, which suggests that investors may be exerting selling pressure.
In contrast, a decrease in the metric suggests that more FTM tokens were exited from the exchange than were entered, resulting in their storage in cold wallets and reduced selling pressure from investors.
In the case of Fantom, this metric experienced a decline from -673,150 to -3.66 million from Sunday to Monday. This decrease in Exchange Flow Balance suggests that investors become more confident as they remove FTM tokens from exchanges and store them in cold wallets. This has resulted in a 3.32% decrease in the supply of FTM tokens on exchanges.

