Coinscreed
  • News
    • Bitcoin News
    • Ethereum News
    • Ripple News
    • Litecoin News
    • Altcoin News
    • DeFi
    • Blockchain News
  • Market Analysis
  • NFT
  • Metaverse
  • Cryptocurrencies
  • Learn
    • Bitcoin 101
    • Ethereum 101
    • Binance Smart Chain
    • DeFi 101
    • Ripple 101
    • ICO 101
    • Trading 101
    • Dogecoin 101
    • Lightening Network
    • NFT 101
  • Crypto How Tos
Advertise
No Result
View All Result
  • bitcoinBitcoin(BTC)
    $29,493.002.06% 24H
    BITCOIN
    24H : 2.06%
    Volume : $15,126,192,247.00
    Marketcap : $561,493,353,622.00
  • ethereumEthereum(ETH)
    $1,982.882.70% 24H
    ETHEREUM
    24H : 2.70%
    Volume : $8,806,551,010.00
    Marketcap : $239,521,893,208.00
  • binancecoinBNB(BNB)
    $312.325.11% 24H
    BNB
    24H : 5.11%
    Volume : $836,735,827.00
    Marketcap : $52,506,973,795.00
  • rippleXRP(XRP)
    $0.4162.95% 24H
    XRP
    24H : 2.95%
    Volume : $1,467,096,809.00
    Marketcap : $20,116,689,221.00
  • cardanoCardano(ADA)
    $0.5335.32% 24H
    CARDANO
    24H : 5.32%
    Volume : $407,154,699.00
    Marketcap : $18,000,003,792.00
  • terra-lunaTerra(LUNA)
    $0.00011-12.34% 24H
    TERRA
    24H : -12.34%
    Volume : $243,631,320.00
    Marketcap : $758,765,318.00
Coinscreed
No Result
View All Result
homerun token
Home Bitcoin News

See Why There Might Be A Price Movement In Bitcoin

Chide Austin by Chide Austin
11 months ago
in Bitcoin News, Bitcoin Price, Market Analysis, News
Reading Time: 4 mins read
A A
Share on FacebookShare on Twitter
Regardless of the fact that Bitcoin had dropped 4% in the past 24 hours at the time of publication, several indicators still appeared to show a positive market for the cryptocurrency.

Lark Davis, a well-known analyst and trader, highlighted these charts when discussing his ideas on Bitcoin’s price in the future and how these charts can help him figure that out.

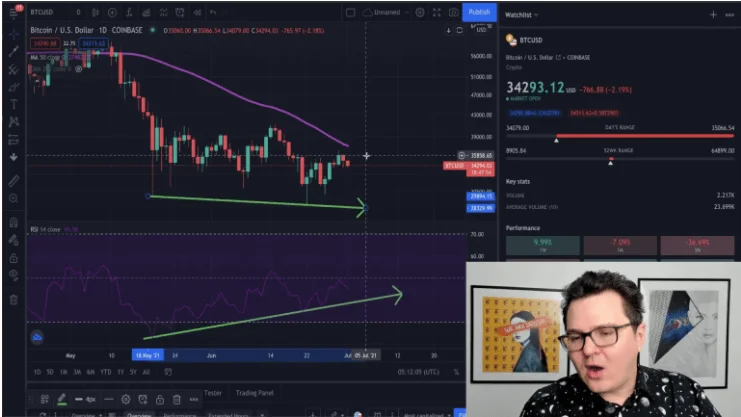
a.) Bullish Divergence

The Bullish Divergence is the first thing that comes to mind when thinking about the market.
When the price makes a lower low and the Relative Strength Index (RSI) makes higher lows, this is referred to as a bullish divergence.

SuggestedArticles

Terra (LUNA) Team Says No Dapps Launched On Terra 2.0

Terra (LUNA) Team Says No Dapps Launched On Terra 2.0 

9 hours ago
Bitcoin: PlanB Reveals Bear Market Is Almost Over

Bitcoin: PlanB Reveals Bear Market Is Almost Over

12 hours ago

The RSI began rising from its oversold position on May 19th, when the price began to decrease, and it has continued to rise since then. The positive divergence on Bitcoin’s chart is formed by such opposing conclusions.

“This shows that the market is starting to build up again. This indicator could indicate that we are getting ready to see that price recovery coming in from Bitcoin” – Davis

Furthermore, the 50 Day Moving Average is also a significant level here, as it would aid in the bullish turnaround.

See Why There Might Be A Price Movement In Bitcoin
Bitcoin Bullish Divergence | Source: Lark Davis

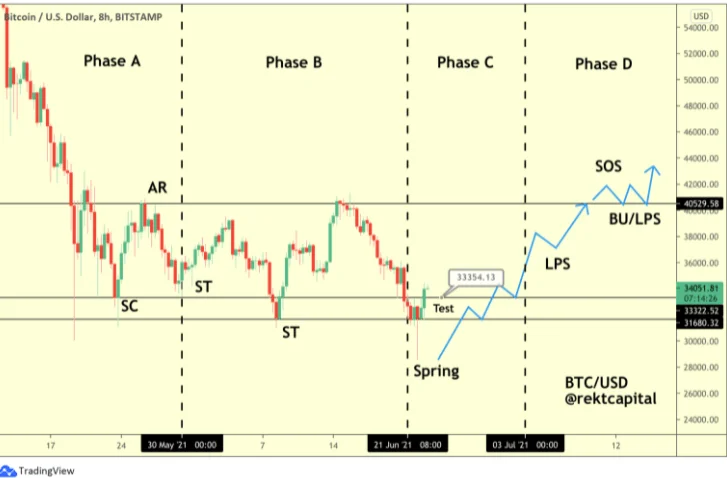
b.) Wyckoff Accumulation

For a long time, this structure has been a heated topic. Although a long-term study revealed a Wyckoff Distribution, the short-term analysis indicated the possibility of a Wyckoff Accumulation.

Phases A and B have already been confirmed, and Phase C will be confirmed with a simple test in the lower $30k-33k area.

A bounce-off could drive BTC into Phase 4 once this phase is completed. As previously said, such a move might assist the coin in reclaiming the $40,000 level, sign of strength (SOS), and then rallying forward.
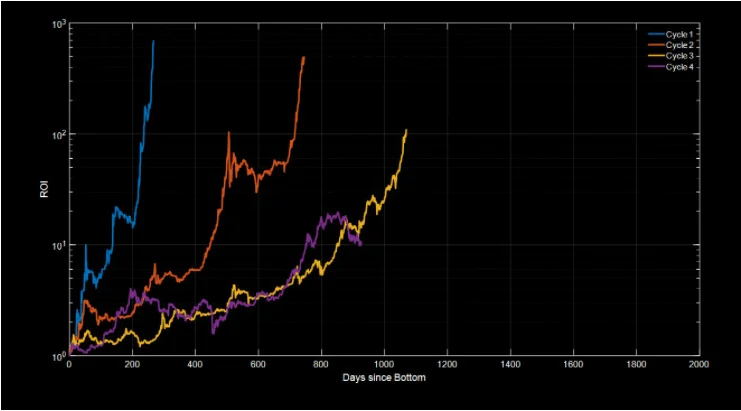
See Why There Might Be A Price Movement In Bitcoin
Short Term Wyckoff Accumulation | Source: Rekt Capital

c.) Bull Cycle
Davis’ final comment was about Bitcoin’s previous bull cycles and how they’ve performed so far. The first-ever Bitcoin bull run was depicted by the blue cycle (Cycle 1).

The 2013 bull run was reflected by the orange line (Cycle 2), while the 2017 bull run was represented by the yellow line (Cycle 3). Finally, the purple line (Cycle 4) identified the active bull cycle that was now in play.

Furthermore, a closer examination revealed that, as the bull cycle lengthens, the total amount of money pushed decreases. According to Davis,

“The current bull market has lasted for significantly less time than the 2017 bull market, which means it is highly unlikely that this bull market cycle has finishe”

For the time being, the currency may enter a period of stabilization before rising to the ROI levels, as it has done in past bull cycles.

See Why There Might Be A Price Movement In Bitcoin
Bitcoin Bull Cycles | Source: Benjamin Cowen

Tags: bitcoinBull cycles

BTC365

Coinscreed

Copyright © 2022 Coinscreed

Navigate Site

  • About
  • Advertise
  • Privacy & Policy
  • Crypto Price Charts

Follow Us

No Result
View All Result
  • News
    • Bitcoin News
    • Ethereum News
    • Ripple News
    • Litecoin News
    • Altcoin News
    • DeFi
    • Blockchain News
  • Market Analysis
  • NFT
  • Metaverse
  • Cryptocurrencies
  • Learn
    • Bitcoin 101
    • Ethereum 101
    • Binance Smart Chain
    • DeFi 101
    • Ripple 101
    • ICO 101
    • Trading 101
    • Dogecoin 101
    • Lightening Network
    • NFT 101
  • Crypto How Tos

Copyright © 2022 Coinscreed

This website uses cookies. By continuing to use this website you are giving consent to cookies being used. Visit our Privacy and Cookie Policy.